That Is It Folks!

I have been providing these reports for almost 10 years.

There has been a continuing decrease in subscribers, as well as changes by the two MLS systems, which would require me to substantially rework the programs. The Baldwin MLS is switching systems, similarly the Birmingham MLS is requiring additional changes.
The Programs which I wrote were based on some very old versions of Access (a Microsoft product) which is also way past it’s prime and in bad need of rewriting from scratch in something modern.
This has made me realize it is time to discontinue the reports.
I can’t thank you all enough for the support and loyalty over the years.
I’ll continue to provide support to the Alabama Center For Real Estate. including surveys, reports and yearly market forecasts. Their site has basic trend data, but not as much detail as I provided.
I’m also freeing up more time to work more in the advanced machine learning areas with healthcare data, something I’ve found quite interesting and challenging and time consuming.
For the time being the Real Estate market look pretty stable and I hope it remain so for all of you.
My very best,
And again,
Thank you.
Tom

Birmingham Area Sales Slightly Cooler In July

Birmingham Area MLS* Monthly Observations for July 2017

Sales were lower both in units and dollars than last year, which was very robust.  Average prices are mostly flat. Total dollar sales for July were $361,764,378, off 5% from $380,693,280 last year, and off 15% from last month of $424,501,685. The market is cooling modestly from last years’ torrid pace.

Total Unit sales were down 8% at 1,637 in July from 1,765 last year and off by 13% compared with 1,891 in June. New sales were down 43 at 132 homes this month, vs. 175 in June, and off by 73 from 205 last year. The low inventory level of new homes suggests a good environment for builders. Used sales were 1,505 homes in July, off 12% from 1,716 last month, and off by 3% from 1,560 last year (Sect E p.3).

ACRE numbers are slightly different from those we report. For ACRE, our month by month 2017 forecast can be seen here: ACRE. For Birmingham, the full year projection for 2017 = 15,238, a 3.6% difference from 2016 actual of 14,705. The cumulative error thru June is minus .6% for the year; that is actuals of 7,554 are behind projections of 7,559. There is a cumulative error on projections of 5 units. Check the link for details when the July numbers are posted.

Total inventory is slightly higher this month at 8,497 vs. last month at 8,155 and less than 9,510 last year. (Sect C p.1). Active New listings decreased to 1,068 in July from 1,081 in June (Sect E p.3). Absorption rate for New homes is at 6 months supply this month, which is less than 7 months last year. (Sect E p.3). New homes have normal inventory levels in the 4-8 month range depending on area and price range (Sect C p.1).

Absorption for Used homes in July shows 5 months, which is lower than 6 last year. Used Active listings at 7,429 are up from last month of 7,074, but less than 8,383 last year (Sect E p.3). Inventory levels have continued to trend down from prior years. A notable exception is however, the over $900,000 price range which has trended up a bit. Market performance is highly area specific, so check the individual area charts. For instance, Mountain Brook has between 1 and 6 months of inventory (except the over $900,000 range with 7 months, 45 units) and 4 months overall. There are a number of MLS areas, particularly those known as the “over the mountain” communities, showing similarly low levels, including Homewood, which has 3 months of inventory.

Birmingham area Average Days on Market for New houses is 217 compared with last month at 204. The Used homes DOM was 102 in July vs 99 last month, (Sect A p.18). Average sales price for Sold New homes decreased to $287,138 from $297,375 last month (Sect A p2). Over a several month period, prices seem to be relatively unchanged. Average sales price for Sold Used was $215,191 this month compared to $217,052 last month. (Sect A p2). Given the general robustness of sales and low inventory levels, prices on average seem quite stable.

TWB 8/13/2017  

Baldwin County Sales 2017 In July Up A Remarkable 34% From 2016

Baldwin County & Alabama Coastal MLS*: Observations for the Month of July 2017

Sales decreased 7% in July to $206,527,230 from June’s outstanding $222,618,471. This is up an impressive 34% from last year’s record of $154,395,353. (Sect A p.2). The 12 month moving average line of sales is headed up substantially. This month’s totals were driven to a large degree by a number of higher end New unit sales in Perdido Key; 14 over $900,000 along with 12 in the $800,000- $900,000 price range.

Inventories continue to drop. Check out the chart on page A-17 to fully appreciate the trend. Note that there are less price range categories for inventories over a year. Now, only the $700,000 and over categories have over a year of inventory. This drop in the upper price level inventories has been very substantial and sustained over the last few months.

In concert with ACRE, The Alabama Center for Real Estate, we have projected expectations for 2017. We use the ACRE provided data for the projections, which differs slightly from the data in this report. The projection for 2017 located here expects projected home sales in 2017 at 6,276, which is a 12.65% over 2016 actual of  5,571. This year through June actual sales are 4% above expectations. 3,312 sales were recorded so far this year which is ahead of the projection of 3,171 by 141 units.  

On a unit basis, sales of all houses were 693 this month vs. last month at 794, which is still well above last year’s healthy level of 627. Used Home sales decreased to 514 this month vs. 639 last month, which is up from last year’s 524 (Sect A p.18). New Home sales were 179 this month vs 155 last month and compared with 103 last year. New listings for New homes increased to 177 from 125 in June. Used homes New listings decreased to 514 from 639 in June with net inventory down.

The absolute number of Used Active homes on the market, which had a slight peak mid-summer of ‘09, has been improving. In July, there were 2,787 Active Used homes, a reduction from 3,330 in June and a new multi year low. New homes, which peaked in July 2006 at 2,144 Active, now sit at 723, and that number has been gradually increasing.

The Absorption rate for New homes was 6 months of inventory in July vs. 9 in June and 11 months last year. The Absorption rate for Used homes was 6 months of inventory in July vs. 7 in June. Over the last four years the drop in months of inventory for Used homes has been steady and impressive from 25 months plus in June 2008 to 6 months this July. I had been expecting construction to begin to pick-up in the under $400,000 range, and this has happened to a modest degree.

Average sales price for all homes has begun to show an upwards trend. For New units, average price jumped to  $444,082 from $260,118 last month (see the 1st paragraph). (Sect A p.14). Average Used home prices decreased this month, to $247,153 from $285,290 in June. Average Days On Market for New Sold properties in July was 389 vs last month of 176 (due to the aforementioned high priced properties having sold). Days On Market for Used was 125 vs. last month 138. The peak summer selling season seems to be roaring!

TWB 8/13/2017

Birmingham Area Real Estate Sales in June Remain Robust

Birmingham Area MLS* Monthly Observations for June 2017

June saw a reduction of 23% in dollar sales from May. Sales were lower both in units and dollars than last year, which was very robust.  Average prices are mostly flat. Total dollar sales for June were $400,193,493, off 5% from $421,620,788 last year, and off 7% from last month of $430,630,025.

Total Unit sales were down 4% at 1,774 in June from 1,841 last year and off by 8% compared with 1,924 in May. New sales were down 12 at 157 homes this month, vs. 169 in May, and off by 13 from 170 last year. The low inventory level of new homes suggests a good environment for builders. Used sales were 1,617 homes in June, off 8% from 1,755 last month, and off by 3% from 1,671 last year (Sect E p.3).

ACRE numbers are slightly different from those we report. For ACRE, our month by month 2017 forecast can be seen here: ACRE. For Birmingham, the full year projection for 2017 = 15,238, a 3.6% difference from 2016 actual of 14,705. The cumulative error is minus .5% for the year; that is actuals are behind projections of 6,033 through May and at 6,002 actual thru May. Check the link to see when the June numbers are posted..

Total inventory is slightly higher this month at 8,821 vs. last month at 8,261 and less than 9,521 last year. (Sect C p.1). Active New listings increased to 1,052 in June from 1,039 in May (Sect E p.3). Absorption rate for New homes is at 6 months supply this month, which is less than 7 months last year. (Sect E p.3). New homes have normal inventory levels in the 4-8 month range depending on area and price range (Sect C p.1).

Absorption for Used homes in June shows 6 months, which is even with 6 last year. Used Active listings at 7,769 are up from last month of 7,222, but less than 8,400 last year (Sect E p.3). Inventory levels have continued to trend down from prior years. Market performance is highly area specific, so check the individual area charts. For instance, Mountain Brook has between 1 and 6 months of inventory and 4 months overall. There are a number of MLS areas, particularly those known as the “over the mountain” communities, showing similarly low levels, including Homewood, which has 3 months of inventory.

Birmingham area Average Days on Market for New houses is 204 compared with last month at 205. The Used homes DOM was 99 in June vs 107 last month, (Sect A p.18). Average sales price for Sold New homes increased to $303,506 from $302,028 last month (Sect A p2). Over a several month period, prices seem to be quite unchanged. Average sales price for Sold Used was $218,023 this month compared to $216,289 last month. (Sect A p2). Given the general robustness of sales and low inventory levels, prices on average seem quite stable, not yet increasing by much.

TWB 7/9/2017

Alabama Coastal Real Estate for June Continues to Outperform

Baldwin County & Alabama Coastal MLS*: Observations for the Month of June 2017

Sales dollars decreased 5% in June to $219,531,971 from May’s outstanding $230,077,838. This is up an impressive 24% from last year’s record of $177,240,799. (Sect A p.2). The 12 month moving average line of sales is moving up substantially.

Inventories continue to drop. Check out the chart on page A-17 to fully appreciate the inventory trends. Note that there are less price range categories for inventories over a year. Now, only the $700,000 and over categories have over a year of inventory. Note that this drop in the upper price level inventories has been very substantial and sustained over the last few months.

In concert with ACRE, The Alabama Center for Real Estate, we have projected expectations for 2017. We use the ACRE provided data for the projections, which differs slightly from the data in this report. The projection for 2017 located here expects projected home sales in 2017 at 6,276, which is a 12.65% over 2016 actual of  5,571. This year through May actual sales are 3% above expectations. 2,623 sales were recorded so far this year which is ahead of the projection of 2,550.  

On a unit basis, sales of all houses were 787 this month vs. last month at 800, which is still well above last year’s healthy level of 666. Used Home sales decreased to 632 this month vs. 676 last month, which is up from last year’s 546 (Sect A p.18). New Home sales were 155 this month vs 124 last month and compared with 120 last year. New listings for New homes decreased to 112 from 204 in May. Used homes New listings decreased to 743 from 850 in May with net inventory down.

The absolute number of Used Active homes on the market, which had a slight peak mid-summer of ‘09, has been improving. In June, there were 2,716 Active Used homes, a reduction from 3,306 in May and a new multi year low. New homes, which peaked in June 2006 at 2,144 Active, now sit at 686.

The Absorption rate for New homes was 7 months of inventory in June vs. 9 in May. The Absorption rate for Used homes was 6 months of inventory in June vs. 7 in May. Over the last four years the drop in months of inventory for Used homes has been steady and impressive from 25 months plus in May 2008 to 6 months this June. I had been expecting construction to begin to pick-up in the under $400,000 range, and this has happened to a modest degree. Sales have been keeping up however, so we have not seen an increase in inventory.

Average sales price for all homes has begun to show an upwards trend. For New units, average price decreased to  $260,118 from $289,610 last month. (Sect A p.14). Average Used home prices decreased this month, to $283,566 from $287,228 in May. Average Days On Market for New Sold properties in June was 176 vs last month of 206. Days On Market for Used was 138 vs. last month 133. The peak summer selling season seems to be roaring!

TWB 7/9/2017

Birmingham May Real Estate Sales Resume Upswing

Birmingham Area MLS* Monthly Observations for May 2017

May saw a substantial increase (23%) in dollar sales from April. Sales were slightly lower in units and slightly higher in dollars than last year, which was very robust. The next few months should show us a more consistent pattern.  Prices are modestly increasing. Total dollar sales for May were $421,269,944 up 3% from $409,254,772 last year, and up 23% from last month at $342,710,819.

Total Unit sales were down 4% at 1,857 in May from 1,943 last year and off by 17% compared with 1,585 in April. New sales were down 17 at 163 homes this month, vs. 180 in April, and off by 13 from 176  last year. The low inventory level of new homes suggests a good environment for builders. Used sales were 1,694 homes in May, up 21% from 1,404 last month, and off by 4% from 1,767 last year (Sect E p.3).

ACRE numbers are slightly different from those we report. For ACRE, our month by month 2017 forecast can be seen here: ACRE. For Birmingham, the full year projection for 2017 = 15,238, a 3.6% difference from 2016 actual of 14,705. The cumulative error is minus 2% for the year; that is actuals are behind projections of 4,451 through April, at 4,440 actual thru April. Check the link to see when the May numbers are posted.

Total inventory is slightly higher this month at 8,635 vs. last month at 8,126 and less than 9,407 last year. (Sect C p.1). Active New listings decreased to 999 in May from 1,033 in April (Sect E p.3). Absorption rate for New homes is at 6 months supply this month, which is less than 7 months last year. (Sect E p.3). The New homes have normal inventory levels in the 4-8 month range depending on area and price range. (Sect C p.1).

Absorption for Used homes in May shows 5 months, which is less than the 6 last year. Used Active listings at 7,636 are up from last month of 7,093, and less than 8,252 last year (Sect E p.3). Inventory levels have continued to trend down from prior years. Market performance is highly area specific, so check the individual area charts. For instance, Mountain Brook has between 1 and 6 months of inventory, 4 months overall. There are a number of MLS areas, particularly those known as the “over the mountain” communities, showing similarly low levels, including Homewood, which has 3 months of inventory.

Birmingham area Average Days on Market for New houses is 205 compared with last month at 198. The Used homes DOM was 107 in May vs 104 last month, (Sect A p.18). Average sales price for Sold New homes increased to $305,046 from $285,446 last month (Sect A p2). Over a several month period prices seem to be quite unchanged. Average sales price for Sold Used was $219,331 this month compared to $207,297 last month. (Sect A p2). Given the general robustness of sales prices on average seem quite stable, not yet increasing by much.

After a brief pause last month sales seem to be back on the upswing, It will be interesting to see how sales unfold over the next few months..

TWB 6/11/2017  

Alabama Coastal Real Estate in May Takes Off

Baldwin County & Alabama Coastal MLS*: Observations for the Month of May 2017

Sales dollars increased a surprising 38% in May to $227,166,434 from April’s slow $164,654,678. This is up a somewhat remarkable 35% from last year’s record of $168,263,418. (Sect A p.2). The 12 month moving average line of sales is moving up substantially.

Inventories continue to drop. Check out the chart on page A-17 to fully appreciate the inventory trends. Note that price ranges in inventories over a year are fewer. Now, only the $600,000 and over categories have over a year of inventory.

In concert with ACRE, The Alabama Center for Real Estate, we have projected expectations for 2017. We use the ACRE provided data for the projections, which differs slightly from the data in this report. The projection for 2017 located here expects projected home sales in 2017 at 6,276, which is a 12.65% over 2016 actual of  5,571. This year through April actual sales are .73% above expectations. 1,938 sales were recorded so far this year which is ahead of the projection of 1,924.  

On a unit basis, sales of all houses were up at 792 this month vs. last month at 622, which is still well above last year’s healthy level of 656. Used Home sales increased to 670 this month vs. 522 last month, which is up from last year’s 557 (Sect A p.18). New Home sales were 122 this month vs 100 last month and compared with 99 last year. New listings for New homes increased to 201 from 156 in April. Used homes New listings decreased to 821 from 852 in April with net inventory down.

The absolute number of Used Active homes on the market, which had a slight peak mid-summer of ‘09, has been improving. In May, there were 2,708 Active Used homes, a reduction from 3,344 in April and a new multi year low. New homes, which peaked in May 2006 at 2,144 Active, now sit at 735.

The Absorption rate for New homes was 7 months of inventory in May vs. 8 in April. The Absorption rate for Used homes was 6 months of inventory in May vs. 7 in April. Over the last four years the drop in months of inventory for Used homes has been steady and impressive from 25 months plus in April 2008 to 6 months this May. I had been expecting construction to begin to pick-up in the under $400,000 range, and this has happened to a modest degree. Sales have been keeping up, so we have not seen an increase in inventory.

Average sales price for all homes has begun to show an upwards trend. For New units, average price increased to  $290,464 from $267,306 last month. (Sect A p.14). Average Used home prices were up this month, to $286,164 from $264,222 in April. Average Days On Market for New Sold properties in May was 206 vs last month of 213. This indicates that some of the older New inventory is being sold. Days On Market for Used was 133 vs. last month 141. With this volatility, it will be interesting to see how the market evolves during the peak summer selling season.

TWB 6/11/2017

Birmingham April Real Estate Sales Moderate Slightly

Birmingham Area MLS* Monthly Observations for April 2017

April saw a surprising reversal of the dramatic increase we saw last month. We saw a similar increase/decrease pattern on the Alabama coast for the last two months as well. Could it be related to the volatile political situation? Or is it just something random? The next few months should show us.  Prices seem to be modestly increasing. Total dollar sales for April were $332,399,621 off 2% from $339,397,305 last year, and off 5% from last month at $348,804,968.

Total Unit sales were off 7% at 1,524 in April from 1,636 last year and off by 11% compared with 1,709 in March. New sales were up at 164 homes this month, vs. 160 in March, and up by 18 from 146  last year. The low inventory level of new homes suggests a good environment for builders, and prices have begun to show a more solid uptrend. Used sales were 1,360 homes in April, off 12% from 1,549 last month, and off by 9% from 1,490 last year (Sect E p.3).

ACRE numbers are slightly different from those we report. For ACRE, our month by month 2017 forecast can be seen here: ACRE. For Birmingham, the full year projection for 2017 = 15,238, a 3.6% difference from 2016 actual of 14,705. The cumulative error is minus 1% for the year; that is actuals are behind projections of 3,200 through April, at 3,162 actual thru March. Check the link to see when the April numbers are posted.

Total inventory is slightly higher this month at 8,484 vs. last month at 7,832 and less than 9,178 last year. (Sect C p.1). Active New listings decreased to 1,000 in April from 1,048 in March (Sect E p.3). Absorption rate for New homes is at 6 months supply this month, which is less than 7 months last year. (Sect E p.3). The New homes have normal inventory levels in the 4-8 month range depending on area and price range. (Sect C p.1).

Absorption for Used homes in April shows 5 months, which is less than the 6 last year. Used Active listings at 7,484 are up from last month of 6,784, and less than 8,105 last year (Sect E p.3). Inventory levels have continued to trend down from prior years. Market performance is highly area specific, so check the individual area charts. For instance, Mountain Brook has between 1 and 6 months of inventory, 4 months overall. There are a number of MLS areas, particularly those known as the “over the mountain” communities, showing similarly low levels, including Homewood, which has 4 months of inventory.

Birmingham area Average Days on Market for New houses is 198 compared with last month at 239. The Used homes DOM was 104 in April vs 115 last month, (Sect A p.18). Average sales price for Sold New homes increased to $292,961 from $275,131 last month (Sect A p2). Over a several month period prices seem to be quite unchanged. Average sales price for Sold Used was $209,084 this month compared to $196,762 last month. (Sect A p2).

It will be interesting to see how sales unfold over the next few months..

TWB 5/13/2017  

April Alabama Coastal Sales Take a Pause

Baldwin County & Alabama Coastal MLS*: Observations for the Month of April 2017

Sales dollars surprisingly decreased 21% in April to $162,333,926 from March’s high  of  $206,329,050. This is still up 10% from last year’s record of $147,415,100. (Sect A p.2). The 12 month moving average line of sales has been heading up substantially. We saw a similar increase/decrease pattern in Birmingham for the last two months as well. Could it be related to the volatile political situation? Or is it just something random? The next few months should show us.

Inventories continue to drop noticeably. Check out the chart on page A-17 to fully appreciate the inventory trends. Note that price ranges in inventories over a year are fewer. Now only the $600,000 and over categories have over a year of inventory.

In concert with ACRE, The Alabama Center for Real Estate, we have projected expectations for 2017. We use the ACRE provided data for the projections, which differs slightly from the data in this report. The projection for 2017 located here expects projected home sales in 2017 at 6,276, which is a 12.65% over 2016 actual of  5,571. This year through April actual sales are .75% above expectations. 1,938 sales were recorded so far this year which is ahead of the projection of 1,924.  

On a unit basis, sales of all houses were off at 617 this month vs. last month at 768, which is still well above last year’s healthy level of 594. Used Home sales decreased to 518 this month vs. 614 last month, which is up from last year’s 507 (Sect A p.18). New Home sales were 99 this month vs 154 last month and compared with 87 last year. New listings for New homes decreased to 155 from 186 in March. Used homes New listings decreased to 831 from 895 in March with net inventory down.

The absolute number of Used Active homes on the market, which had a slight peak mid-summer of ‘09, has been consistently improving. In April, there were 2,793 Active Used homes, a reduction from 3,296 in March and a new multi year low. New homes, which peaked in April 2006 at 2,144 Active, now sit at 710.

The Absorption rate for New homes was 7 months of inventory in April vs. 8 in March. The Absorption rate for Used homes was 6 months of inventory in April vs. 7 in March. Over the last four years the drop in months of inventory for Used homes has been steady and impressive from 25 months plus in March 2008 to 6 months this April. I had been expecting construction to begin to pick-up in the under $400,000 range, and this has happened to a modest degree. Sales have been keeping up, so we have not seen an increase in inventory.

Average sales price for all homes has begun to show an upwards trend. For New units, average price increased to  $264,897 from $245,230 last month. (Sect A p.14). Average Used home prices were off this month, to $262,759 from $274,534 in March. Average Days On Market for New Sold properties in April was 213 vs last month of 176. This indicates that some of the older New inventory is being sold, a good thing. Days On Market for Used was 141 vs. last month 144. With this volatility, it will be interesting to see how the market evolves during the peak summer selling season.

TWB 5/13/2017

Birmingham Area Sales Accelerate In March

Birmingham Area MLS* Monthly Observations for March 2017

Mar2017BHAMindexed

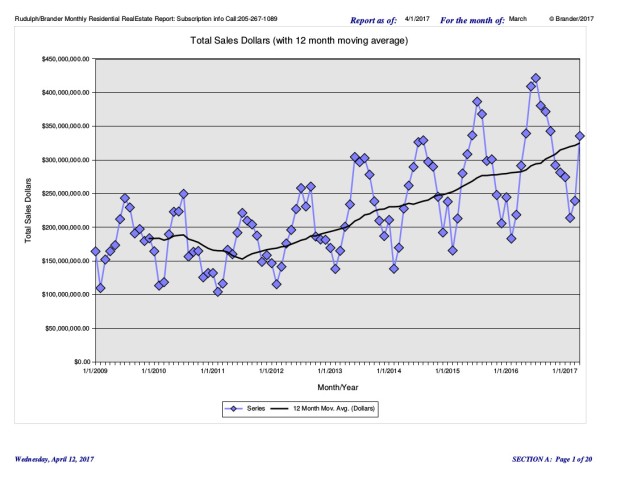
March saw an acceleration of the uptick in dollar and unit sales over last year.  Prices seem to be modestly increasing. Total dollar sales for March were $335,608,193 up 15% from $291,558,899 last year, and up 40% from last month at $239,312,908.

Total Unit sales were up 6% at 1,629 in March from 1,530 last year and up by 35% compared with 1,204 in February. New sales were off at 150 homes this month, vs. 155 in February, and off by 30 from 175 last year. The low inventory level of new homes suggests a good environment for builders, and prices have begun to show a more solid uptrend. Used sales were 1,479 homes in March, up 41% from 1,049 last month, and up by 9% from 1,355 last year (Sect E p.3).

ACRE numbers are slightly different from those we report. For ACRE, our month by month 2017 forecast can be seen here: ACRE. For Birmingham, the full year projection for 2017 = 15,238, a 3.6% difference from 2016 actual of 14,705. The cumulative error is minus 1% for the year; that is actuals are behind projections of 3,200 through March, at 3,162 actual thru March.

Total inventory is slightly higher this month at 8,150 vs. last month at 7,851 and less than 9,313 last year. (Sect C p.1). Active New listings decreased to 997 in March from 1,067 in February (Sect E p.3). Absorption rate for New homes is at 6 months supply this month, which is less than 7 months last year. (Sect E p.3). The New homes have normal inventory levels in the 4-8 month range depending on area and price range. (Sect C p.1).

Absorption for Used homes in March shows 5 months, which is less than the 6 last year. Used Active listings at 7,153 are up from last month of 6,784, and less than 8,228 last year (Sect E p.3). Inventory levels have continued to trend down from prior years. Market performance is highly area specific, so check the individual area charts. For instance, Mountain Brook has between 1 and 6 months of inventory, 4 months overall, except in the $5-$600,000 and over $900,000 category, which each have 6 months of inventory. In the over $900,000 price range there were 40 homes, with 9 sold in that price range last month. There are a number of MLS areas, particularly those known as the “over the mountain” communities, showing similarly low levels, including Homewood, which has 4 months of inventory.

Birmingham area Average Days on Market for New houses is 239 compared with last month at 197. The Used homes DOM was 115 in March vs 125 last month, (Sect A p.18). Average sales price for Sold New homes decreased to $276,271 from $288,821 last month (Sect A p2). Over a several month period prices seem to be increasing. Average sales price for Sold Used was $198,896 this month compared to $185,458 last month. (Sect A p2).

All in all, the market continues to look quite healthy.
TWB 4/12/2017